Keeping up with technology is something that MAJORITY of people in Market Access struggle with.
If we don’t stay up to date, we will soon become outdated. Could we soon become outdated for the very positions we currently hold? Parents today say that their 2-year-olds are teaching them how to use the TV remote.
A well-kept secret of IT professionals is that they don’t know everything. When they do not know the answer to an IT-related question, they just Google it. That’s it. No magic to it.
So before complaining about SharePoint again, try to figure out a solution to the problem by Googling it.
Figuring it out will take us much further than complaining about it.
Everyone likes figure-outers–the world needs more of them.
Objectives set (1) expectations for meetings as well as (2) guardrails that keep the discussion on-course.
It’s important to set expectations so that the attendees can come adequately prepared (I’ve been to meetings where the person who’s presenting didn’t even know that he was going to present—imagine that!).
It’s important to set guardrails to ensure everything on the agenda is given enough time during the 1 hour.
When done right, objectives start with a verb (which is rarely the word “discuss” because it’s too ambiguous).
Creating an effective payer value proposition requires shifting from inside-out thinking to one that’s outside-in (rather than telling them what you want, tell them what they need to hear). An enticing value proposition is one that bridges the gap and helps payers connect previously unconnected dots. Here are some thoughtful questions that will help create rich messages for your payer value proposition:
Does your asset solve a new problem or is it another/better solution to an old problem?
Do payers know that they have this problem that you can solve for them?
Are you leveraging an asset that others don’t have?
Why hasn’t the problem been solved? What stands in the way? Is this even a real problem?
Are you combining the previously uncombined in a way that’s hard to duplicate?
Are you marketing an asset that will create its own inertia, disrupting existing value chains and improving as it goes?
Is there any substantial reason why payers won’t simply switch to a cheaper alternative?
How much better do you need to be than the status quo to get someone to leap and switch to your asset?
How long can you sustain this change? What happens when the market changes?
There will always be limitations: limitations based on market dynamics, resources available to you, data to support the product, and the list goes on.
But what assets do you already have? Challenge yourself to write down 50 assets. What about 100? You may just surprise yourself. And who knows…the limitations themselves just might be your biggest assets!
In the words of the artist Phil Hansen, who was forced to abandon art due to a disability, later channeled it to create art in ways no one else had before him: “instead of telling each other to seize the day, maybe we can remind ourselves everyday to seize the limitation.”
“If you bring forth what is within you, what you bring forth will save you. If you do not bring forth what is within you, what you do not bring forth will destroy you” –Gospel of Thomas.
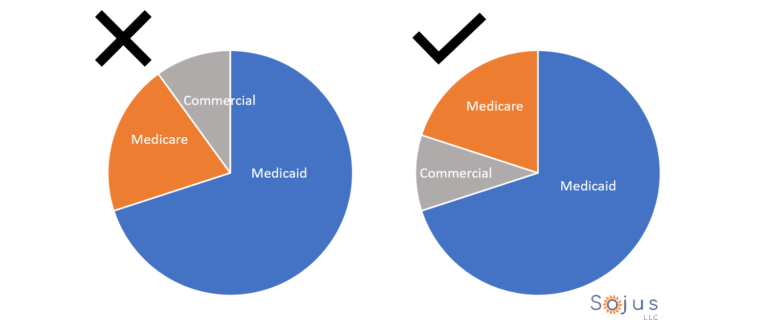
This advice is unsettling at first because pie charts are ubiquitous in market access. But he makes some really good points.
If you decide to use pie charts and have more than 2 segments, make sure that the 2 segments you most care about each start at midnight, with one moving clockwise and the other going counterclockwise.
In the examples below, Medicare and Medicaid are the 2 segments of focus. Without having the data labels (this was intentional), could you infer from the the left-hand example that Medicaid = 70% and Medicare = 20%? (It’s hard to determine the size of the Medicare sector because it doesn’t start at midnight). Could you infer the same from the right-hand example? Yes!
It can feel like drinking from a fire house when information is coming from a million different sources for a particular project. More information means greater likelihood to get lost in its sea.
Staying in control of the information is critical because if it can’t be found when you need it, it might as well not exist.
Here’s the organization system that works for me:
All information (PDFs, other documents, and relevant emails) are filed into the “Background Materials” folder of the project
Also within the “Background Materials” folder is a Word document titled “Document Key” which is basically a table that lists descriptions of all of the files within the folder. It’s a simple table with unlimited rows (1 per document) and 3 columns:
“Materials”: brief description of what’s in the file
“Date”: time stamp of the file; all files are arranged in chronological order
“File Name”: name of the file as it appears in the folder
For every minute spent organizing, an hour is earned –Benjamin Franklin
A slide riddled with bullets can use help from some visualization so that the audience can “get the joke” on the slide within seconds.
Try drawing out the idea on paper. Drawing out the idea not only helps to better understand it, but it can also uncover new findings.
After drawing out the idea, see which diagram family it might belong to (it might belong to a combination of families):
Flow
Linear
Circular
Divergent/convergent
Multidirectional
Structure
Matrices
Trees
Layers
Cluster
Overlapping
Closure
Enclosed
Linked
Radiate
From a point
With a core
Without a core
If you’ve gotten this far, congratulations! The hard work is done. Now it’s a matter of choosing a diagram template (diagrammer.com is a PHENOMENAL resource) and plugging in the information.
Back at his workshop, the writer creates an outline, draws countless diagrams, does hours of research—and might even re-do some of this because it didn’t work the first time.
None of this will see the light of day. What everyone sees a simple, singing deck.
Remember that time when you came out of a medical/legal review as glazed over as a donut?
When a medical/legal review comment flies in the face of what YOU believe it should be, ask yourself: “why is he right?”
Before throwing solutions at the wall in hopes that something will stick, understand what’s really at the root of his concern. Listen for clues in his response. It may not what you had imagined AT ALL.