This advice is unsettling at first because pie charts are ubiquitous in market access. But he makes some really good points.
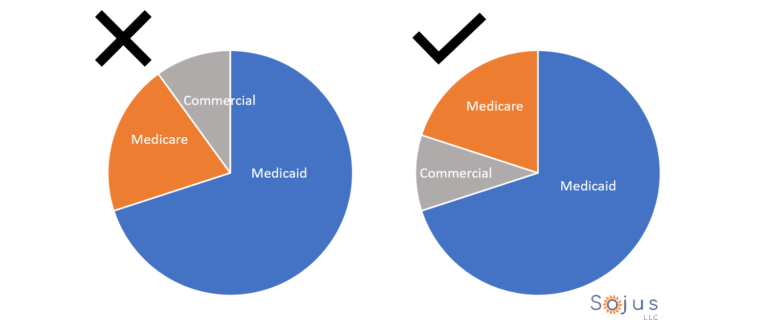
If you decide to use pie charts and have more than 2 segments, make sure that the 2 segments you most care about each start at midnight, with one moving clockwise and the other going counterclockwise.
In the examples below, Medicare and Medicaid are the 2 segments of focus. Without having the data labels (this was intentional), could you infer from the the left-hand example that Medicaid = 70% and Medicare = 20%? (It’s hard to determine the size of the Medicare sector because it doesn’t start at midnight). Could you infer the same from the right-hand example? Yes!